

The feedback was consistent but noisy.
In one-on-ones, people mentioned technical debt. In retrospectives, missing documentation. In Slack, frustration with CI/CD. In planning meetings, lack of business context. None of it was wrong — but taken together, it was overwhelming.
We had real problems, limited capacity, and no obvious place to start.
This is a common failure mode for teams at scale: everything hurts a little, and guessing wrong is expensive.
So instead of picking the loudest complaint or the one I personally cared about most, I tried to make the signal clearer.
Turning anecdotes into signal
Around that time, I was reading about the SPACE framework for developer productivity. I didn’t adopt it wholesale, but one idea stuck with me: measure perception, not just output.
I designed a simple internal survey to turn scattered feedback into something comparable. When the results came back, three areas scored the worst:
CI/CD: 18 out of 100
Documentation: 27 out of 100
Focus: 36 out of 100
Everything else was manageable. We had our priorities.
For example, code reviews generated a lot of noise — people complained about slow pickup times constantly. But in the survey, code reviews scored 56 out of 100. Much better than expected. The loudest problem wasn’t the biggest one.
I chose to focus on those three areas, even though it meant deprioritizing issues people were more vocal about.
How I set up the survey
The first step is picking areas that matter to your team. A simple heuristic: look through recent retrospectives and focus on the recurring themes. But keep the categories general — you’ll want to run this survey again in six months, and while specific problems change, the broader categories tend to stay stable.
For my team, I settled on five areas: code reviews, CI/CD and engineering systems, testing, business context and documentation, and developer experience (focus, flow, perceived productivity).
When you share the survey, explain that it’s a tool to improve how the team works, and that everyone’s input matters. Set a deadline and send reminders — either directly, or if you’re leading a team of teams, ask managers to nudge their people. You’re unlikely to get 100% participation, but aim for 70-80% so you have enough material to act on.
How to analyze the results
Once you have the scores, connect each scale question with its follow-up responses. Now you have both the number and the reasoning behind it. If you collected team information, you can also compare responses across teams for the same question — sometimes one team scores 70% while another scores 30%, and that gap is worth investigating.
At this point, you should see the bigger picture of how your team is doing. You can either create an action plan yourself and present the results to the team, or organize a workshop to go through the findings together and build the plan collaboratively.
I recommend running the survey about every six months. Quarterly feels too frequent — serious issues take longer to resolve, and you don’t want the survey to become background noise. Once a year is too rare — the team and the business change, and both your insights and your action plan will get stale.
Focus beats effort
We stopped treating everything as equally urgent.
Instead of spreading effort across technical debt, documentation, tooling, and process at the same time, we focused deliberately on a small set of constraints:
CI/CD reliability and speed
Documentation where it directly unblocked work
Focus — reducing unnecessary interruptions and meetings
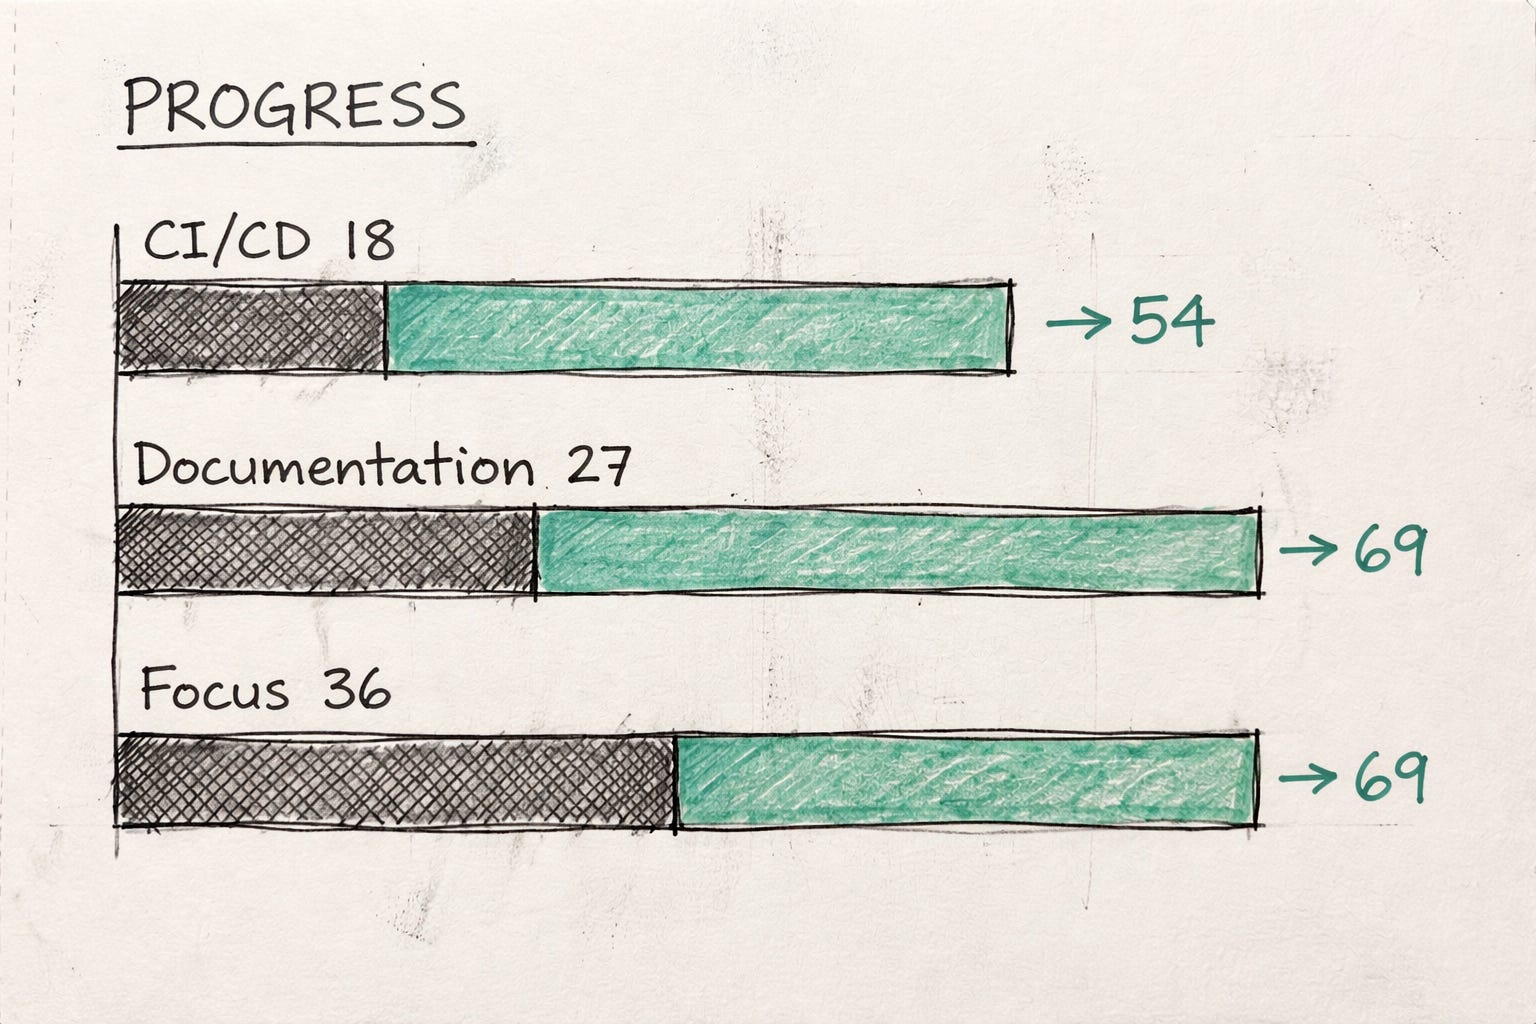
Nine months later, we ran the same survey again.
CI/CD: 18 → 54
Documentation amount: 27 → 69
Documentation quality: 55 → 77
Focus: 36 → 69
I heard less about CI/CD and missing documentation in retrospectives and Slack conversations. When a system just works, there’s not much to talk about.
Why this worked
Not because surveys are magic. And not because we discovered something new.
It worked because it enforced two disciplines that are easy to skip when you’re busy:
Separate signal from volume. You can’t fix everything, and the loudest issue isn’t always the most damaging one. Measuring forces you to choose deliberately.
Close the loop. Measuring again matters as much as measuring once. Otherwise it’s just theater.
The broader lesson
As teams grow, leadership becomes less about having good instincts and more about designing systems that surface reality early.
Surveys are one example. There are others. The exact mechanism matters less than the intent: replace intuition alone with feedback loops you can trust.
It’s easy to fill your calendar managing operations. It feels like work. But reacting to whatever’s loudest doesn’t fix the system — it just keeps you busy.
Find the real constraint and focus there. It might not be the loudest problem — but it’s the one that actually moves the team forward.
I’ve shared the survey template you can copy it and adapt it for your team: Developer Productivity Survey Template
Thank you for reading. If you’re new here, I write about the messy realities of engineering leadership—the things I wish someone had told me when I first started leading teams.
→ Learn more about me and why I started this newsletter
If you found this useful, consider subscribing. And if you have thoughts, questions, or just want to say hi, reply to this email or comment on Substack.